
Business Central Reporting Performance Guide for 2026

Thomas Werkhoven
Business Central Reporting Performance Guide for 2026
19:30
Month-end closes have a way of exposing every reporting bottleneck in your Microsoft Dynamics 365 Business Central environment. One report runs in seconds on Tuesday, then grinds for minutes on the last day of the quarter. Your finance team loses hours waiting, and every delay pushes analysis and advice further down the calendar.
This guide walks you through the root causes of slow Business Central reporting performance, practical fixes you can apply right away, and longer-term strategies that keep reports fast as data grows. You will also find troubleshooting methods, data hygiene practices, and Excel-based workflows that help controllers reclaim time for analysis.
Exsion365 gives finance teams a direct Excel connection to live Business Central data, eliminating the export-and-paste cycle that adds minutes to every report run. Throughout this guide, you will see where that kind of workflow fits into a broader performance strategy.
Key Takeaways: Business Central Reporting Performance
- Slow Business Central reports usually trace back to broad date filters, missing keys, or heavy report layouts.
- Tightening filters and scheduling large runs overnight are the fastest fixes most finance teams can apply today.
- Data growth, FlowField overuse, and concurrency conflicts compound each other over consecutive reporting periods.
- Excel-based reporting tools like Exsion365 reduce month-end delays by pulling live data without in-app rendering overhead.
- Regular housekeeping, targeted key management, and telemetry monitoring prevent performance problems before users notice them.
Why Does Business Central Reporting Slow Down at Month End?
During normal operations, most Business Central reports run against a manageable set of transactions. At month end, three things change at once: data volume spikes from closing entries, more users run reports simultaneously, and posting routines compete for the same database resources.
The result is a queue. Reports that finished in seconds now sit behind posting jobs, integration syncs, and other sessions. Add a broad date filter ("All dates" instead of "Last month"), and the report has to scan millions of rows that have nothing to do with your current period.
Understanding this overlap between reporting load and transactional load is the first step toward fixing performance. The sections below break each contributing factor into an actionable category.
Common Causes of Slow Reports in Business Central
Overly Broad Filters and Date Ranges
Running a report with "All dates" forces Business Central to read every relevant ledger entry since the company was created. For a finance team that only needs last month's P&L, this wastes time and server resources. Saved views with pre-set date filters solve this for most teams in under five minutes.
As a rule, every report request page should default to the current fiscal period. Encourage your team to use specific date ranges rather than open-ended parameters. This single habit can cut report run time by 60 percent or more on large datasets.
Missing or Misaligned Database Keys
Business Central uses keys (similar to SQL indexes) to find records quickly. When a report filters on fields that do not have a supporting key, the system performs a full table scan. On tables like Item Ledger Entry or Value Entry, that scan can take minutes.
The Database Missing Indexes page in Business Central identifies where the platform expects a key but does not have one. Reviewing this page quarterly, and adding targeted composite keys that match real filter patterns, keeps read times low without inflating posting costs.
Heavy Report Layouts and Rendering Overhead
If a report preview loads quickly but the PDF takes a long time, the layout is the bottleneck. Complex RDLC layouts with nested groupings, page breaks per item, and calculated expressions inside cells create rendering overhead that multiplies with every row.
Simplifying the layout, reducing nested groups, and moving totals into the dataset (calculated in AL instead of in the layout engine) are the three changes with the largest impact. For reports where formatting is not critical, exporting to Excel or CSV bypasses layout rendering entirely.
FlowField Overuse on List Pages and Reports
FlowFields are calculated fields that aggregate data from related tables on the fly. They work well for single-record lookups. On a list page displaying hundreds of records, each FlowField triggers a separate database call per row.
Multiply that by five or six FlowFields on a busy list, and you have thousands of queries every time the page loads. Removing non-essential FlowFields from high-traffic pages and moving heavy calculations to factboxes or drill-down pages reduces this load significantly.
Concurrency Conflicts Between Posting and Reporting
Posting routines lock records to maintain data integrity. When a report tries to read the same table that a posting job is writing to, the report waits. If multiple posting jobs run during peak reporting hours, these waits cascade.
Separating posting, imports, and reports into distinct job queue categories with staggered schedules is a proven fix. Heavy reports run overnight; posting runs during business hours on a separate lane.
How to Diagnose Business Central Reporting Performance Issues
Step 1: Reproduce the Problem With Specific Parameters
Replace "the report is slow" with a reproducible test case. Record the report name, filters used, the company, the time of day, and the observed duration. Note whether the delay is on preview, PDF, or both. Compare a fast example against a slow one.
Run your test in a sandbox environment when possible. Diagnosing performance in production risks adding more load to an already strained system.
Step 2: Use Telemetry to Identify the Layer
Business Central can emit telemetry data to Azure Application Insights. Key signals include long-running AL methods, slow SQL queries, lock timeouts, and deadlocks. According to Microsoft's 2026 Wave 1 documentation, the platform now includes enhanced financial reporting features with audit logs and scheduling that improve how teams track report performance.
Start with the time range of the slow operation and determine whether elapsed time concentrates in AL logic, SQL execution, an external call, or lock waiting. This classification dictates which fix to apply.
Step 3: Profile the Code Path
Use the AL Profiler in Visual Studio Code or the Client Performance Profiler in the Business Central web client. These tools show which procedures consume the most time, including event subscribers from installed extensions.
A small method called thousands of times can matter more than a single slow procedure. Pay special attention to subscribers that run inside posting or reporting flows, since they add latency to every execution.
Step 4: Classify the Problem and Apply the Right Fix
Once you have data from the first three steps, match your findings to one of these categories:
- Slow list open, sort, or filter: Missing key or heavy FlowFields. Check the Missing Indexes page and simplify list fields.
- Slow posting that blocks reports: Locking or contention. Inspect lock timeout and deadlock telemetry, then stagger job queues.
- Slow report on large datasets: Too many fields retrieved or inefficient AL loops. Adopt partial records with SetLoadFields and optimize iteration patterns.
- Everything slow at certain times of day: Resource contention from concurrent jobs. Reschedule heavy operations to off-peak windows.
- Performance drop after an extension update: Regression. Isolate the change in a sandbox and profile event subscribers.
Practical Fixes for Faster Month-End Reporting
Tighten Default Filters on Every Report
The single most effective change is setting sensible default filters. For month-end reports, default the date filter to the current fiscal period. For aging reports, default to the last 90 or 365 days. Publish these defaults as saved views so your team does not drift back to "All dates."
Add Targeted Composite Keys Based on Evidence
Add keys only when telemetry or the Missing Indexes page confirms a gap. Composite keys that align posting date, entity number, and location code to your most common filter patterns give the largest improvement. Review keys quarterly and remove any that are no longer needed.
Keep in mind that every key increases the cost of write operations. A targeted approach, where you add the minimum set needed for your heaviest reports, balances read speed against posting performance.
Simplify Report Layouts and Reduce Rendering Time
If PDF rendering is the bottleneck, reduce nested groups in the RDLC layout to a single level where possible. Move calculated totals into the AL dataset. Remove unused fields from the dataset to cut the payload that the rendering engine processes.
For reports that only need numbers, skip rendering entirely. Deliver the output as an Excel file or CSV through a scheduled job. Your team gets the data faster, and the server avoids the layout overhead.
Schedule Heavy Reports Outside Business Hours
Any report that spans long date ranges or aggregates large volumes should run on a scheduled queue overnight. Create a dedicated REPORTS job queue category and separate it from POSTING and IMPORTS. Set sensible concurrency limits so one long-running report does not block everything else.
Business Central's job queue system lets you deliver results by email, so your team finds completed reports in their inbox each morning.
Use Partial Records to Load Only What You Need
The SetLoadFields method in AL tells Business Central to retrieve only the columns your code needs. For loop-heavy report logic, this reduces the amount of data transferred per record and can cut execution time by half or more on extended tables.
This is especially important in environments with many installed extensions, since each extension widens the table and increases the I/O cost of loading full records.
How Excel-Based Reporting Workflows Improve Performance
Built-in Business Central reports render inside the application, which means they compete with every other process running in that environment. Exporting data to Excel for analysis offloads the rendering and calculation work to your local machine or Microsoft 365 cloud.
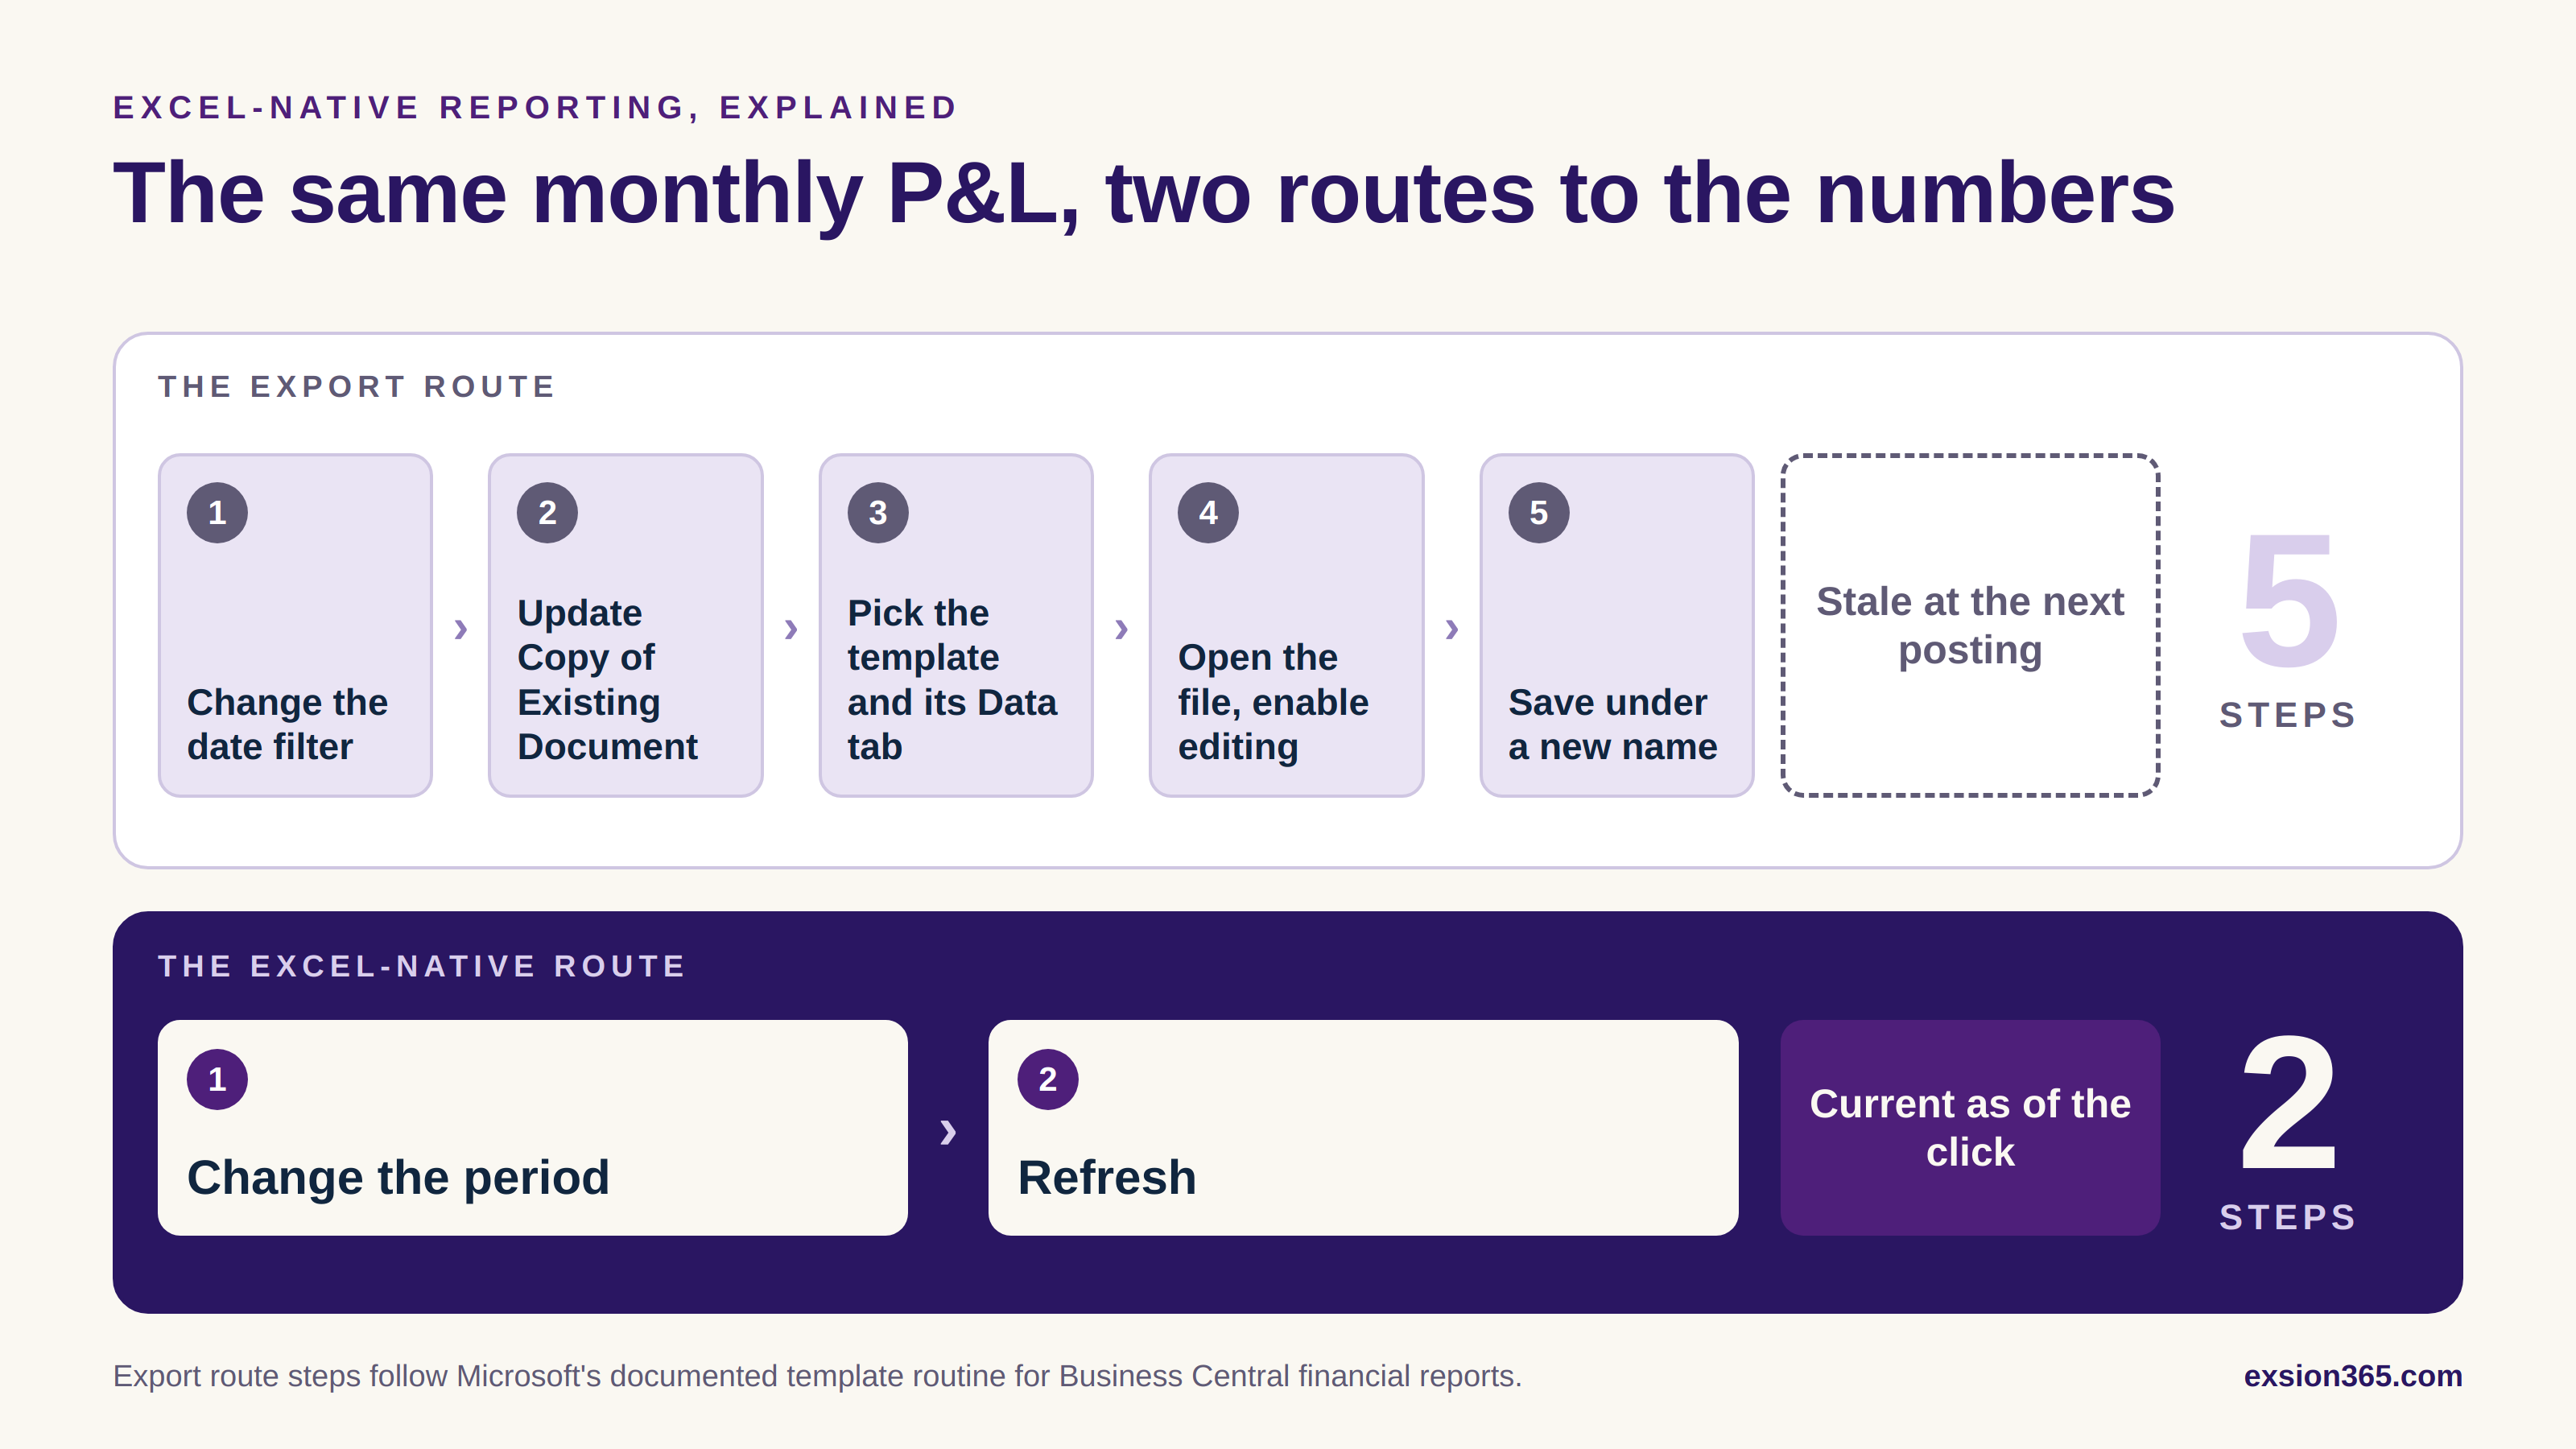
Exsion365 takes this further by connecting Excel directly to live Business Central data. Instead of running a report inside Business Central and then exporting, you pull data into a pre-built Excel template and click Refresh. The result is the same information with no in-app rendering delay.
For controllers running P&L statements, cash flow reports, or bank reconciliations at month end, this approach cuts the reporting cycle from hours to minutes. Reports built in Exsion365 use reusable templates that your team can refresh every period without rebuilding anything.
Data Hygiene Practices That Prevent Reporting Slowdowns
Compress Historical Data Responsibly
Business Central's G/L Date Compression reduces the row count in historical ledger tables by combining old detail entries into summary records. Before compressing, confirm your audit retention requirements. Once compressed, the original detail is gone.
For most organizations, compressing entries older than two fiscal years is safe and can reduce General Ledger Entry row counts by 80 percent or more. The performance benefit for reports that scan these tables is immediate.
Manage Change Log Settings Carefully
The Change Log tracks field-level modifications. Logging too many fields, especially high-churn fields on transaction tables, creates a large secondary dataset that slows down both the Change Log entries page and any process that references it.
Audit only the fields your compliance team requires. Set retention policies to automatically purge old entries. Revisit your configuration at least once a year as business processes change.
Keep Analysis Views Lean and Updated
Analysis Views are pre-aggregated datasets used by built-in analysis reports. If you have views configured with dimensions you no longer use, they consume storage and update time without adding value. Remove unused views and schedule updates for remaining ones during off-peak hours.
Avoid the "Update on Posting" option for analysis views at scale. This forces the system to recalculate the view on every posting operation, adding latency to every transaction.
How Extensions and Customizations Affect Report Speed
Every installed extension can add event subscribers that execute during report runs. A single subscriber that performs an HTTP call or reads a large table adds latency to every row the report processes. Multiply that across ten extensions, and the cumulative effect is significant.
When report performance degrades after an extension update, the fastest diagnosis path is to spin up a sandbox without the suspected extension and rerun the same report with identical parameters. If the performance gap closes, the subscriber is the cause.
Profile event subscribers attached to report and query events. Use feature flags in your own extensions to toggle heavy logic off during peak reporting windows. This gives you control over the trade-off between functionality and speed.
Building a Performance Monitoring Routine for Finance Teams
Most teams only investigate performance when users complain. By that point, the problem has been building for weeks or months. A lightweight monitoring routine catches slowdowns before they affect your closing schedule.
Start by baselining your top five most-used reports. Record the run time with fixed parameters (same filters, same company, same time of day) and repeat the measurement monthly. Plot the trend. If run times increase by more than 20 percent month over month, investigate before the next close.
If your environment has Azure Application Insights configured, build a simple dashboard that surfaces the top slow pages, reports, and processes. Include lock timeout counts and deadlock signals. This dashboard becomes your early warning system and takes less than a day to set up.
What Microsoft's 2026 Wave 1 Means for Reporting Performance
Microsoft's 2026 Wave 1 release introduced several enhancements to financial reporting in Business Central. Report authors can now use categories, override global defaults for negative number format and report period, and display the company logo on PDF outputs.
Report users gained the ability to schedule reports for distribution groups and run reports over all values of a dimension in a single execution. Administrators can set global defaults and monitor report usage through a new audit log.
These features improve governance and reduce the number of one-off report requests. They do not, however, change the underlying database performance dynamics. The filter, key, and data hygiene strategies in this guide remain essential regardless of which Business Central version you run.
How Exsion365 Fits Into Your Business Central Performance Strategy
Exsion365 complements Business Central's built-in reporting by moving the data retrieval and analysis steps into Excel. This means your Business Central environment handles fewer concurrent report requests, freeing resources for posting and transactional work during peak hours.
With Exsion365, controllers can build P&L statements, variance analyses, and bank reconciliation reports in Excel using live Business Central data. Every report refreshes with a single click, and templates are reusable across periods and companies.
For finance teams managing multiple entities, Exsion365 supports multi-company and multi-environment reporting from one workbook. This eliminates the need to run separate reports inside Business Central for each entity, which is one of the most common causes of month-end reporting congestion.
In Conclusion: Faster Reporting Starts With Evidence, Not Guesswork
Slow reporting in Business Central is not a mystery. It traces back to identifiable factors: broad filters, missing keys, heavy layouts, concurrent workloads, and growing data volumes. The fix in every case starts with measurement.
Baseline your reports, review telemetry, and apply targeted changes one at a time. Combine these database-level improvements with an Excel-based reporting workflow using Exsion365, and your finance team can close the books faster while spending more time on analysis and strategic advice.
If you want to see how this looks in practice, contact the Exsion365 team for a no-obligation conversation about your specific reporting challenges.
FAQs About Business Central Reporting Performance
Why do Business Central reports slow down during month-end closing?
Month-end reports slow down because data volume spikes, more users request reports simultaneously, and posting routines lock shared tables. Narrowing date filters and scheduling heavy reports overnight are the fastest fixes.
How can I find which reports are causing performance problems?
Use Azure Application Insights telemetry to identify long-running reports and slow SQL queries. The Client Performance Profiler in Business Central's web client also captures timing data per report.
Does adding more database keys always improve report speed?
Not always. Keys speed up reads when they match real filter patterns, but each key increases write costs during posting. Add the minimum set based on evidence from the Missing Indexes page, then measure the result.
How does Exsion365 help with Business Central reporting performance?
Exsion365 connects Excel directly to live Business Central data, so you can build and refresh reports outside the application. This reduces the reporting load on your Business Central environment and eliminates rendering overhead for your finance team.
What is SetLoadFields and how does it improve report performance?
SetLoadFields is an AL method that tells Business Central to load only specific columns for each record. In loop-heavy reports, this reduces data transfer and processing time, especially on tables extended by multiple apps.
Can Exsion365 handle multi-company reporting in Business Central?
Yes. Exsion365 supports multi-company and multi-environment reporting from a single Excel workbook. Controllers can pull data from all entities into one consolidated report and refresh it with a single click.
How often should finance teams review Business Central reporting performance?
Monthly baselining is the minimum. Record run times for your top five reports using fixed parameters. If run times increase by more than 20 percent, investigate before your next month-end close.