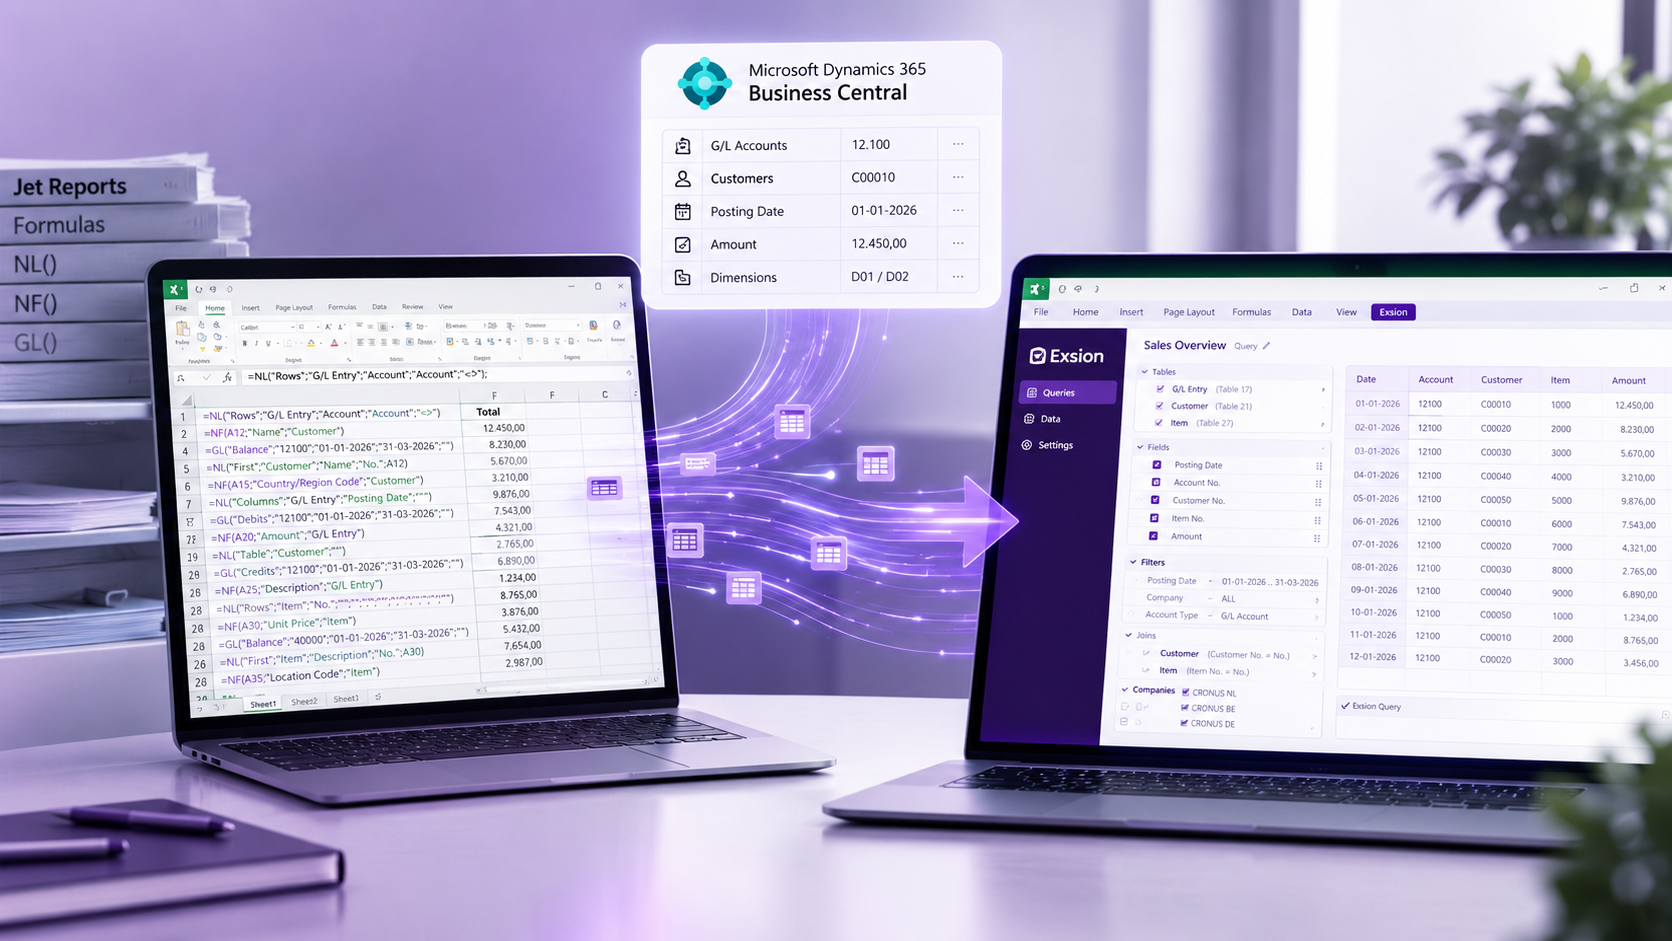
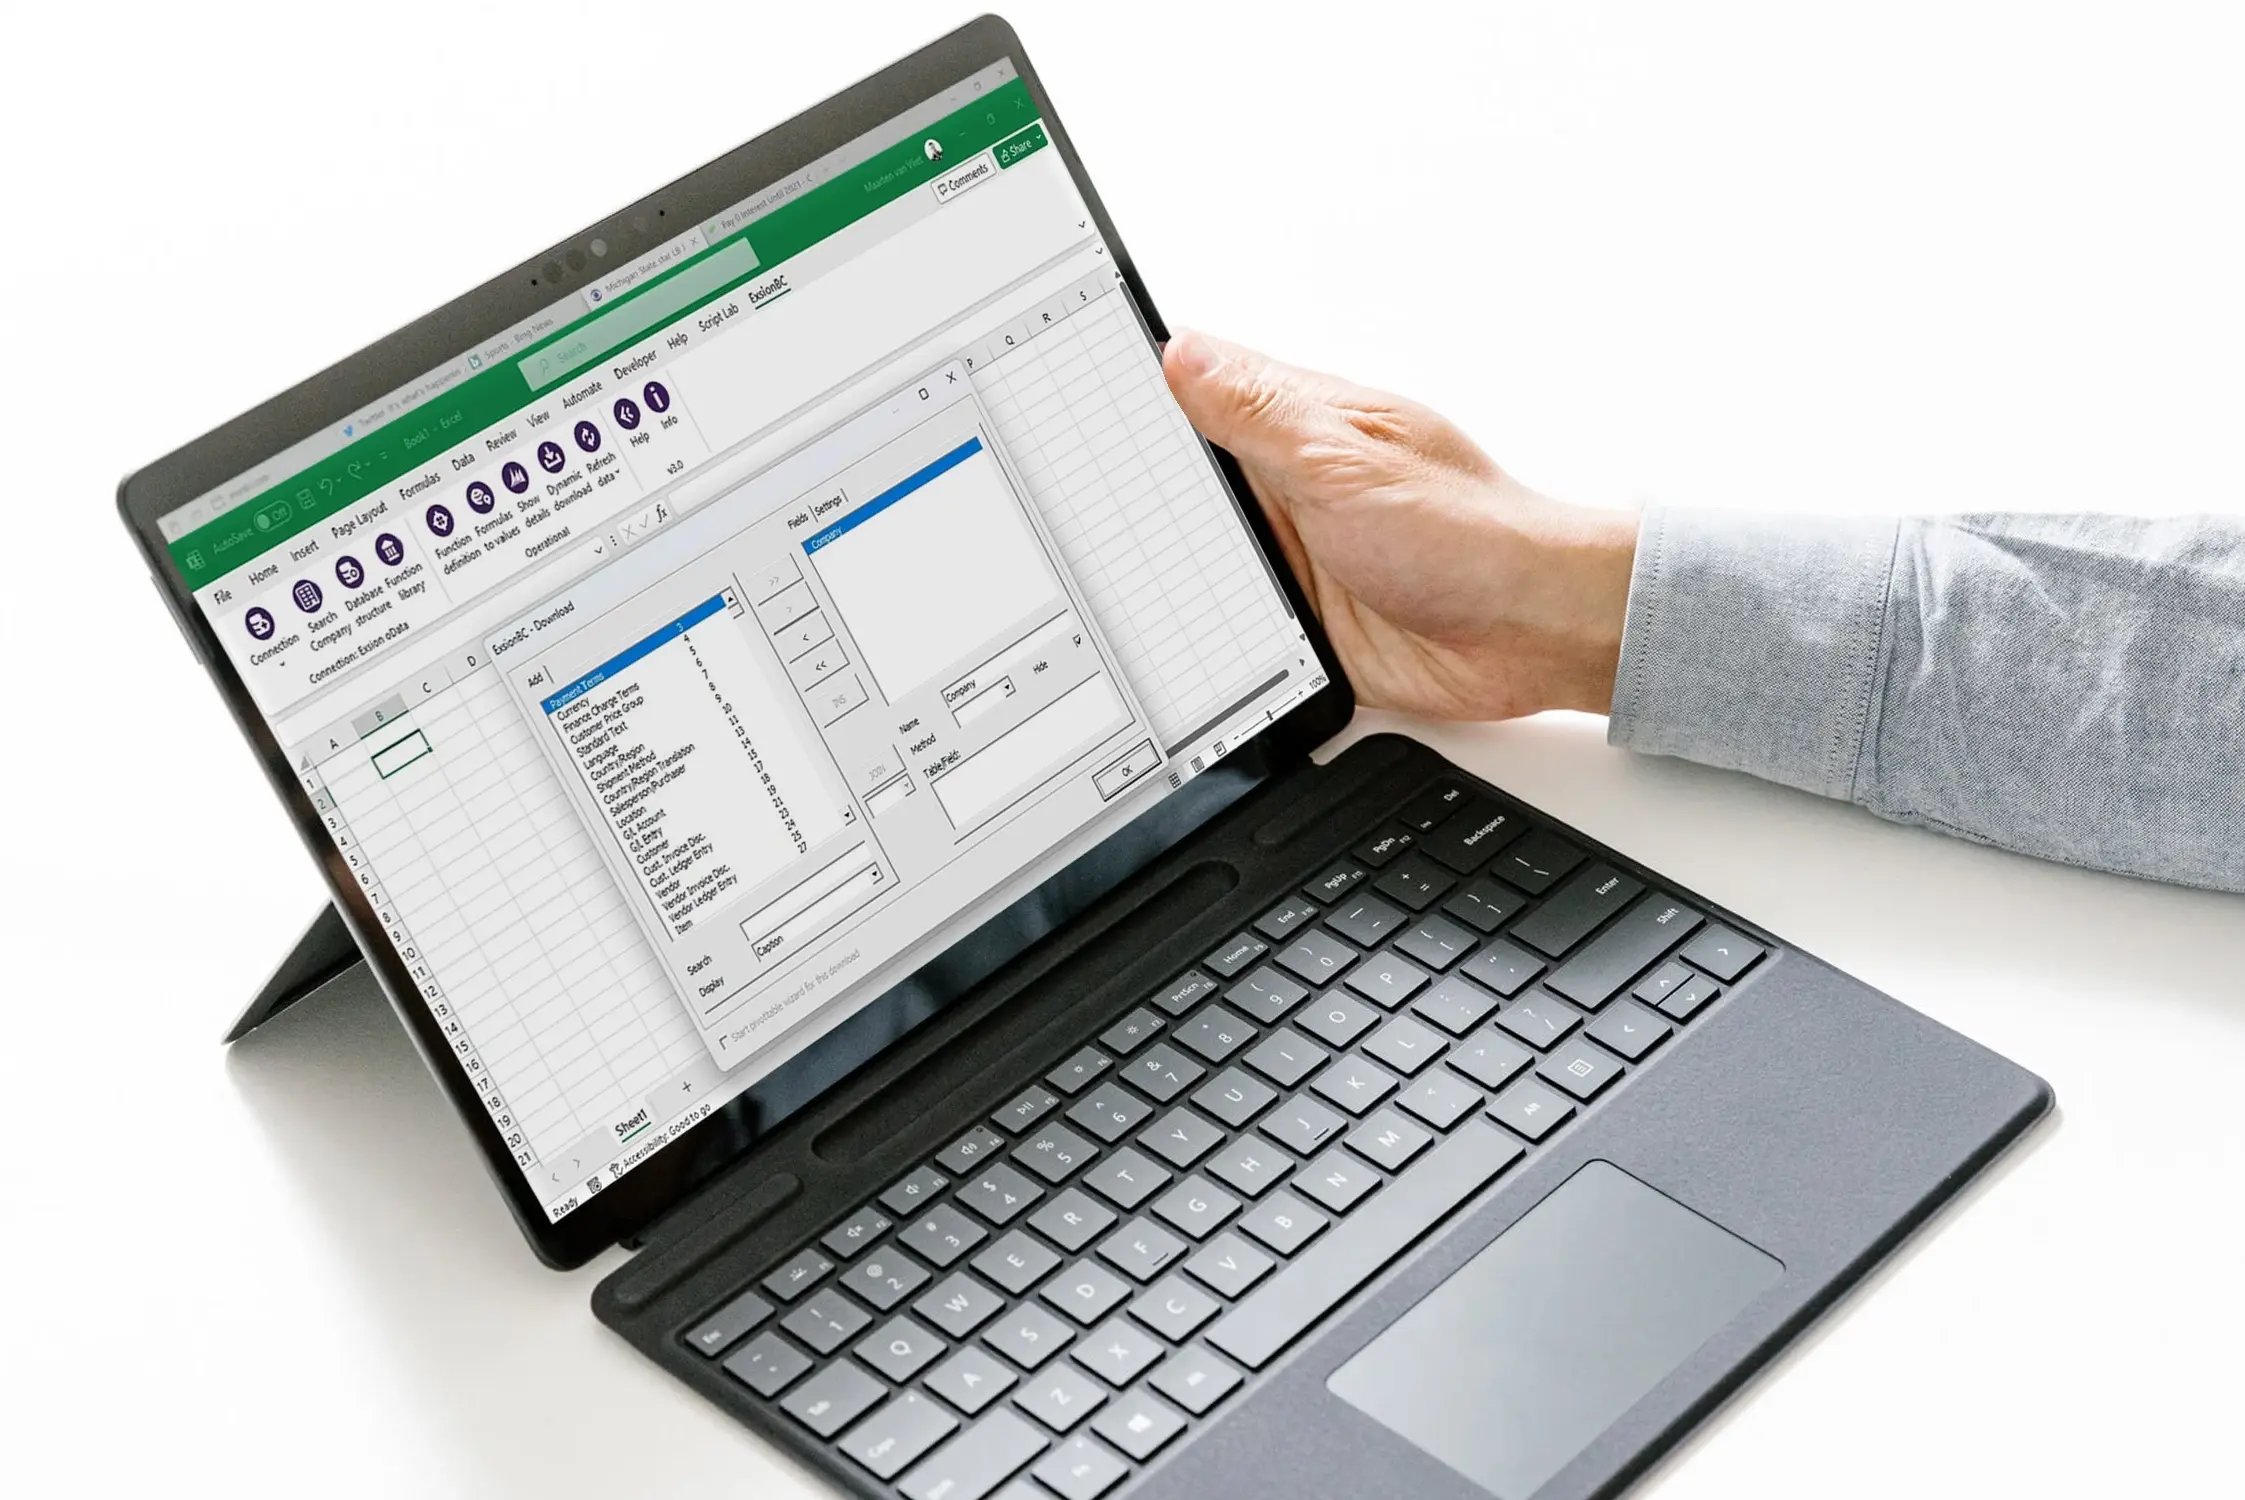

To consolidate multiple companies in Business Central, you map every general ledger account in every entity to a Business Central account category and subcategory, validate that no account is left unmapped, then pull all entities into a single Excel sheet and refresh. The account category structure becomes the shared reporting language across entities that have different charts of accounts. Once the mapping is complete and validated, a consolidated profit and loss across five companies refreshes in one click, and every consolidated figure can be traced back to the individual account and company that produced it.
That is the whole method. The rest of this article shows what each step actually looks like, including the part most consolidation guides skip, which is proving the mapping is correct before anyone reports on the numbers.
Watch the five-company consolidation in under four minutes
[[VIDEO_LOOM: https://www.loom.com/embed/37c8b896b2e34bcaaa9f8a9baa2aee22]]
Chapters
- 0:00 What we are building: a consolidation sheet for five Business Central companies
- 0:17 The prerequisite: account category and subcategory on every account, in every company
- 0:37 Validation functions, and why they run first
- 0:51 The validation sheet: filtering column I for accounts that are not applicable
- 1:08 Finding the one account still mapped incorrectly
- 1:17 Show details: drilling through to the exact company and account to fix it
- 1:42 Refresh: the complete mapping table, retrieved directly from Business Central
- 2:09 All companies, current year and prior year, in one sheet
- 2:24 The property section: selecting which companies to include
- 2:40 Setting the period, including 6 for a half year close
- 2:48 Switching from calendar months to accounting periods
- 3:16 When a number surprises you
- 3:24 The pivot table: double-click any figure for the full breakdown
- 3:38 Account number and company, in one click
Why consolidating Business Central companies is harder than it looks
Ask a controller why the group P&L takes four days and you rarely hear about the arithmetic. Adding five numbers together is not the problem. Three other things are.
The first is that the five entities almost never share a chart of accounts. The Dutch holding was set up in 2014, the German subsidiary came in through an acquisition with its own account numbering, and the two project companies were cloned from a template that has since drifted. Account 4310 means something different in each one. Any consolidation has to reconcile those charts before it can add anything up.
The second is that nobody can prove the mapping is complete. In most groups the mapping lives in a spreadsheet that one person maintains. When a new account is opened in one entity, it silently falls outside the mapping, and the consolidated total is quietly wrong until someone notices a variance three months later. There is no alarm.
The third is that consolidation destroys traceability. The moment you sum five entities into one figure, the CFO asks why other operating expenses jumped 18 percent, and you are back in five separate Business Central sessions with the export button. The consolidated report answers the first question and creates the second.
A method that solves the arithmetic but not these three has not solved consolidation.
What native Business Central consolidation asks of you
Business Central does ship consolidation functionality, and it is worth understanding before you decide anything. Each company in the consolidation becomes a business unit, and the numbers are transferred into a separate consolidated company that Microsoft describes as a container for the consolidated data with no live business data of its own. For each posting general ledger account in each company you specify the Consol. Debit Acc. and Consol. Credit Acc. fields to say where the balance should land in the consolidated company. If entities report in different currencies, you set exchange rate methods per account on the Setup Business Unit Currencies page, typically average rate for income statement accounts, closing rate for balance sheet accounts, and composite rate for retained earnings.
It works, and for a stable group with a genuine statutory consolidation requirement it may be exactly right. Two things are worth knowing going in. Microsoft's own documentation states that processing consolidation eliminations is a manual process. And the consolidated company is a periodic transfer rather than a live view, so a management report built on it reflects the last time someone ran the consolidation, not the ledger as it stands this morning.
For a controller who needs a group P&L every month rather than a statutory consolidation every year, that is often more machinery than the job requires.
The foundation: G/L account categories and subcategories
Every method described below rests on one Business Central field pair, so it is worth being precise about it.
On the G/L Account Card, each account carries an Account Category and an Account Subcategory. Business Central has six fixed categories: Assets, Liabilities, Equity, Income, Cost of Goods, and Expense. Subcategories are the flexible layer, and Microsoft's documentation is explicit that subcategories are more flexible than categories because you define them yourself. Microsoft also states that all accounts in the chart of accounts should be listed in a selected category and subcategory, and that the mapping between G/L accounts and account categories is the most important feature of Business Central's financial reports.
Most groups have this field partially filled in. The standard accounts inherited from the setup wizard carry a category. The accounts finance opened later, particularly the ones opened in a hurry at year end, often do not.
That partial state is fine for a single entity, because a gap shows up as a missing line on one report and someone spots it. Across five entities it is corrosive, because an unmapped account in the smallest subsidiary produces a consolidated total that looks entirely plausible and is wrong.
So the first real task in any Business Central consolidation is not building a report. It is filling in Account Category and Account Subcategory for every account number, in every company, without exception. In the walkthrough this is stated at 0:17 and it is stated first for a reason.
Why this field and not a mapping table in the reporting tool
It is tempting to keep the mapping in the reporting layer, where a controller can edit it quickly. The argument for keeping it in Business Central is that the mapping then lives in the system of record, is visible to everyone who opens the G/L Account Card, is covered by the same permission model as the rest of the ledger, and is maintained by the person who opens the account rather than by the person who builds the report. When a new account is created, the subcategory is filled in as part of creating it, not as a downstream correction.
It also means the mapping is not hostage to a reporting tool. If the group changes reporting software in three years, the group reporting structure stays where it is.
Step one, build the menu and set your consolidation structure
The workbook starts with a menu sheet that holds the parameters for the whole consolidation, so a controller changes settings in one place rather than editing formulas across tabs.
Before touching it, agree the subcategory structure the group will report on. This is a finance decision, not a technical one. The subcategories become the line items of the consolidated P&L, so the level of detail you choose here is the level of detail the CFO gets. Too coarse and every review meeting turns into a drill-down exercise. Too fine and the report becomes a trial balance with a nicer font. A workable rule is that each subcategory should be a line someone would actually ask a question about.
Step two, validate before you trust a single number
This is the step that separates a consolidation you can defend from one you cannot.
Before any analysis, the validation sheet lists every account across every company alongside its category and subcategory mapping. Column I carries the mapping status, and the check is simple: filter for anything not equal to not applicable. Anything that appears in that filter is an account that has not been mapped, in a company you are about to consolidate.
In the walkthrough, five companies and a full chart of accounts produce exactly one hit, an equipment account in one entity missing its subcategory. That is a realistic number. It is also exactly the kind of gap that would have gone unnoticed in a spreadsheet-based mapping, because the account was small and nobody was looking for it.
Run this filter every close, not just at implementation. New accounts appear continuously, and this is the only cheap moment to catch them.
Fixing an unmapped account without leaving the report
Finding the gap is half the value. The other half is closing it quickly.
Selecting Show Details on the flagged row takes you directly to that specific account, in that specific company, so the missing subcategory can be entered at source. There is no hunting through five Business Central sessions to work out which entity the account belongs to, and no note in a spreadsheet promising to fix it later.
The correction is made in Business Central, which means it benefits every report the group runs, not just this workbook.
Step three, refresh and confirm the mapping table is complete
Back in Excel, one refresh rebuilds the mapping table directly from Business Central, and the adjustment made moments earlier is already in it. Re-run the validation filter and it returns nothing.
That is the point at which the mapping table is a complete, current picture of how every account in every entity rolls up, retrieved from Business Central rather than maintained alongside it. From here the numbers can be trusted, because the structure underneath them has been proven rather than assumed.
Step four, select your companies and periods
With the mapping in place, the data for every company is pulled into the sheet for the current year and the prior year at the same time, so the comparison is built in rather than bolted on.
Which companies are included is controlled in the property section. You can type company names directly, use an asterisk as a wildcard to pick up a naming pattern such as all entities sharing a prefix, or search the environment and select the specific companies you want. This matters more than it sounds. A group that reports at several levels, for example all entities, then the Dutch entities only, then the construction entities only, can produce each view by changing a filter rather than by maintaining three separate reports.
The period is set the same way. Enter 12 for a book year ending in December, or 6 to close a half year. The comparison year sits alongside it, so a year to date consolidated P&L against the same period last year is two fields.
When your fiscal calendar is not twelve calendar months
Plenty of Business Central customers do not run on calendar months. Construction groups often work in four-week periods, and retail groups frequently use a 4-4-5 calendar. If the period setting is switched from month to accounting period, the report follows the accounting periods defined in Business Central rather than assuming a calendar month, so the consolidated figures line up with the periods the business actually closes on.
This is a small setting with a large consequence. A consolidation that quietly reports calendar months to a business that closes on four-week periods will disagree with every operational report in the building.
Step five, drill from the consolidated number back to the source
Now the CFO asks the question.
Alongside the consolidated report sits a pivot table containing the full detail behind it. Double-clicking any figure returns the breakdown of that number: which account numbers, in which companies, made it up. A consolidated other operating expenses line that looks 18 percent high resolves in one click into the five entity contributions, and from there into the accounts driving the variance.
The practical difference is in the meeting. A question about a consolidated number is answered while it is being asked, in the same file, rather than becoming an action point that takes half a day and arrives after the decision has been made. The same click-through works for any figure in a standard report, not just a consolidated one; see our guide on how to drill down to the underlying transactions in Excel for Business Central.
How this compares to the other options
There are four credible routes to a consolidated Business Central P&L, and the honest answer is that they suit different situations.
Native Business Central consolidation is the right choice when you have a genuine statutory consolidation requirement, a stable group structure, and the appetite to maintain consolidation accounts and exchange rate methods per account. Its cost is setup depth and manual elimination processing, and its output is periodic rather than live.
Power BI is strong when consolidated finance data needs to sit next to operational data in a dashboard for a wide internal audience. Its cost is that someone has to build and maintain a data model, and that the controller who wants a new line in the P&L usually cannot add it alone. For a lighter-weight alternative that a controller can still shape directly, see our guide on how to build management reports in Excel.
Specialist Excel reporting tools cover this ground with real capability, and the category has moved quickly. Velixo, which supports Business Central alongside Acumatica, Sage Intacct and several other ERPs, publishes multi-entity consolidation functionality including intercompany eliminations and multi-currency translation. InsightSoftware's Jet Reports, the long-standing incumbent, also addresses consolidation. Cosmos positions on speed and pre-built templates for Business Central. Anyone telling you the alternatives cannot consolidate at all is not being straight with you.
What actually separates them at evaluation time is narrower and more useful to test:
[[TABLE_START]]
Question to ask in a demo | Why it matters
Where does the account mapping live? | Mapping held in Business Central is maintained by finance in the system of record. Mapping held in the tool is another artefact to keep current.
Can the tool prove the mapping is complete before I report? | Without a validation step, an unmapped account in a small entity produces a plausible wrong total.
Can I get from a consolidated figure to the account and company in one action? | This is the question you will be asked in every review meeting.
Does it respect Business Central user permissions? | Inheriting the existing permission model avoids maintaining a second security model.
Does it follow my accounting periods, or assume calendar months? | Only relevant if your fiscal calendar is not standard, and decisive if it is.
How many ERPs is the vendor building for? | Depth on Business Central specific objects tends to follow focus.
[[TABLE_END]]
Exsion's position on that list is deliberate. The mapping lives in Business Central's own account category fields, validation runs before reporting rather than after, drill-down returns account and company in one click, permissions are inherited from Business Central, and Business Central is the only ERP the product is built for.
When you need Exsion Corporate instead
The method in this article uses Excel reporting for Business Central and works when all entities live in Business Central and can share a common account category and subcategory structure. For a five-company group in one environment, that covers it.
Some groups need more. If entities sit in different databases or different systems, if the charts of accounts cannot be reconciled through account categories alone, or if the consolidation requires normalisation and transformation beyond a shared mapping, Exsion Corporate is the product built for that. It reports across multiple databases and is designed for consolidation reporting as well as CSRD reporting.
The decision point is simple. If a shared account category structure across your Business Central companies is achievable, start with the method above. If it is not, the group needs a dedicated consolidation layer.
A realistic implementation checklist
Take this into a scoping conversation.
- Confirm every entity in scope runs in Business Central and list them by name as they appear in the environment.
- Export the chart of accounts from each entity and count how many accounts have Account Category or Account Subcategory empty. This number tells you the size of the preparation work.
- Agree the group subcategory structure with the CFO, at the level of detail the group P&L should show.
- Fill in category and subcategory for every account in every company, then validate that no exceptions remain.
- Confirm whether the group reports on calendar months or on Business Central accounting periods.
- Decide which reporting levels you need, for example whole group, by country, by division, and check they can be expressed as company filters.
- Agree who owns the mapping going forward, and add filling in the subcategory to the procedure for opening a new G/L account.
Step seven is the one groups skip, and it is the one that keeps the consolidation correct in year two. If you want to see the method against your own chart of accounts, Exsion Reporting has transparent pricing and a 30-day trial.
Frequently asked questions
[[FAQ_START]]
How do I consolidate multiple companies in Business Central? | Map every general ledger account in every company to a Business Central account category and subcategory, validate that no account is left unmapped, then pull all companies into a single Excel report and refresh. The account category structure acts as the shared reporting language across entities with different charts of accounts, which is what makes the totals comparable.
Do I need to set up a consolidated company in Business Central? | Not for the method described here. Business Central's native consolidation transfers entries into a separate consolidated company that acts as a container for consolidated data, which requires business unit setup, consolidation accounts on each posting account, and exchange rate methods per account. Reporting on account categories directly from the source companies in Excel produces a consolidated view without that setup, and reads live data at refresh rather than at the last transfer.
Can I see which company and account a consolidated number came from? | Yes. The consolidated report is accompanied by a pivot table holding the underlying detail, and double-clicking any consolidated figure returns the breakdown showing which account numbers in which companies produced it. This keeps drill-down available inside Excel rather than requiring a return to individual Business Central sessions.
Does Business Central handle intercompany eliminations automatically? | No. Microsoft's own documentation states that processing consolidation eliminations is a manual process. That is one of two things worth knowing before choosing the native route, the other being that the consolidated company is a periodic transfer rather than a live view.
What happens if someone opens a new G/L account and forgets the subcategory? | The validation sheet catches it. It lists every account across every company with its mapping status, and filtering that column for anything not equal to not applicable returns the accounts that have not been mapped. Run that filter every close, because new accounts appear continuously.
Can this follow a 4-4-5 or four-week fiscal calendar? | Yes. Switching the period setting from month to accounting period makes the report follow the accounting periods defined in Business Central rather than assuming calendar months, which matters for construction groups on four-week periods and retail groups on a 4-4-5 calendar.
[[FAQ_END]]